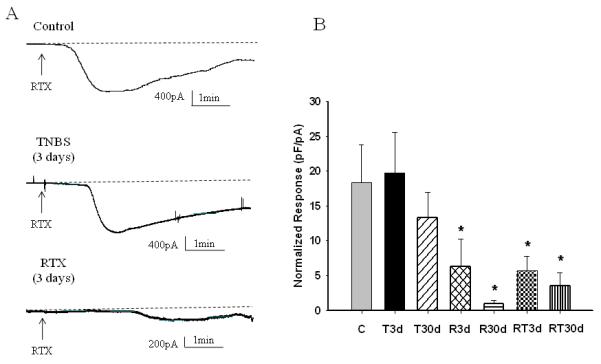
Figure 6. Responses of isolated bladder sensory neurons to in vitro application of RTX.

A, Raw traces of inward current recorded in response to 10−7 M of RTX in control and experimental groups. B, Amplitude of the RTX response normalized to the cell size in all groups. C- Control, T3d – 3 days after TNBS application, T30d – 30 days after TNBS treatment, R3d – 3 days after intracolonic RTX instillation, R30d – 30 days after intracolonic RTX instillation, RT3d - 3 days after TNBS treatment following intracolonic RTX, RT30d - 30 days after TNBS treatment following intracolonic RTX. * p≤0.05 indicates statistical significance when compared to the control group.
