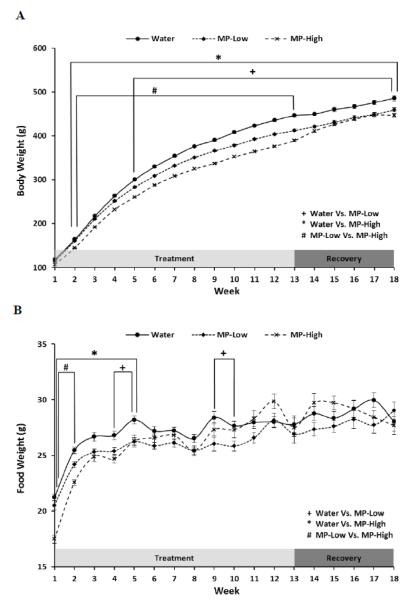
Figure 1. Body Weight and Food Intake.
Line graphs showing: A) Body weight, and; B) Food intake; for the three treatment groups (Water, MP-Low, and MP-High) during the 13 weeks of treatment and 5 weeks of untreated recovery. Markers indicate average weekly weight for each group with error bars denoting SEM. Results were compared between treatment groups each week using 2-way repeated measures ANOVA, followed by pairwise comparisons using the Holm-Sidak method. All comparisons were considered significant for p-values < 0.05. Weeks in which results significantly differed are spanned by brackets and marked with symbols to identify the groups that differed.

