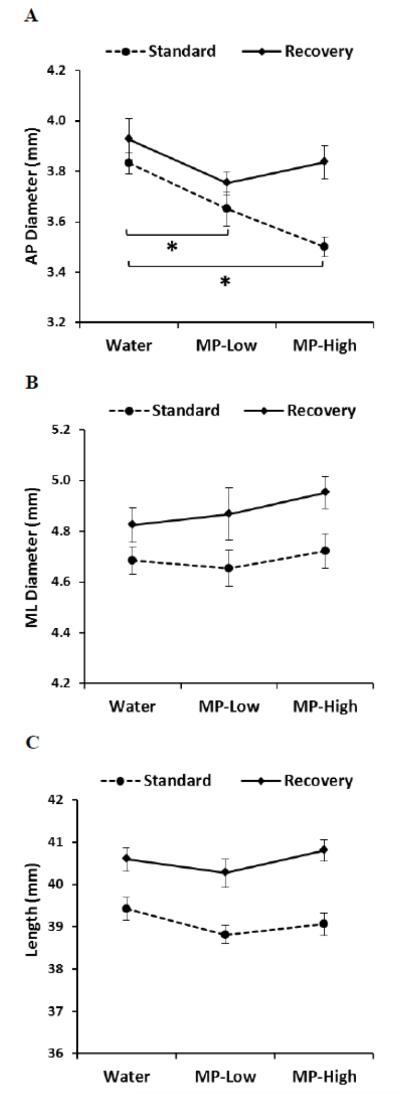
Figure 2. Femoral Caliper Measurements.
Line graphs showing results of caliper measurements of femoral: A) Anterior-posterior (AP) diameter; B) Medial-lateral (ML) diameter, and; C) Length; for the three treatment groups (Water, MP-Low, and MP-High) analyzed immediately after 13 weeks of treatment (Standard) and following 5 weeks of untreated recovery (Recovery). Markers indicate group average with error bars denoting SEM. Results were compared between groups within each dosing protocol using ANOVA, followed by pairwise comparisons with Dunnett’s tests. All comparisons were considered significant for p-values < 0.05. Significant differences between treatment groups from the standard protocol are indicated by brackets and asterisks.

