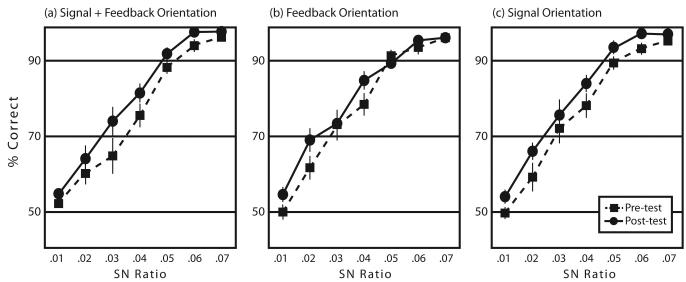
Figure 4.
The mean percentage of correctly detected grating patches for: (a) the signal+feedback orientation, the orientation that involved both a stimulus and response feedback in the valid-feedback trials, (b) the feedback orientation, the orientation that was pre-determined as the correct answer in the fake-feedback trials, and (c) the signal orientation, the orientation that was presented as the stimulus in the fake-feedback trials.

