
Figure 1.
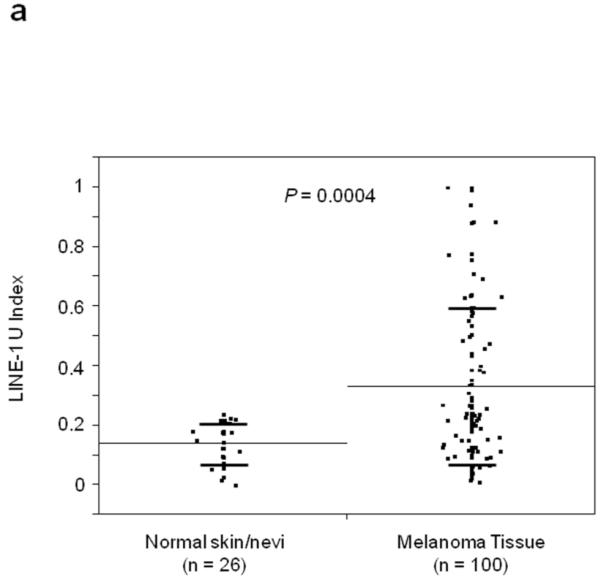


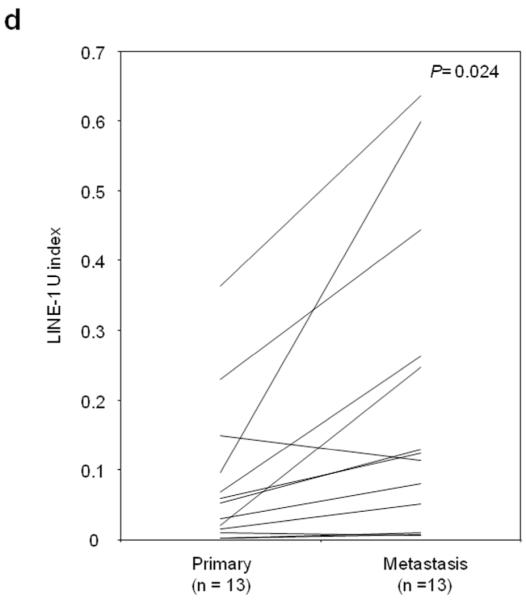
Individual and mean (solid horizontal line) LINE-1 U-Index values for tissue specimens of normal skin vs. primary/metastatic melanoma (A), normal skin vs. primary melanoma vs. metastatic melanoma (B) and according to the AJCC stage (C) and primary and metastatic paired samples (D). P values were obtained by Student’s t-test (A, D), Tukey’s HSD (B) and ANOVA (C).