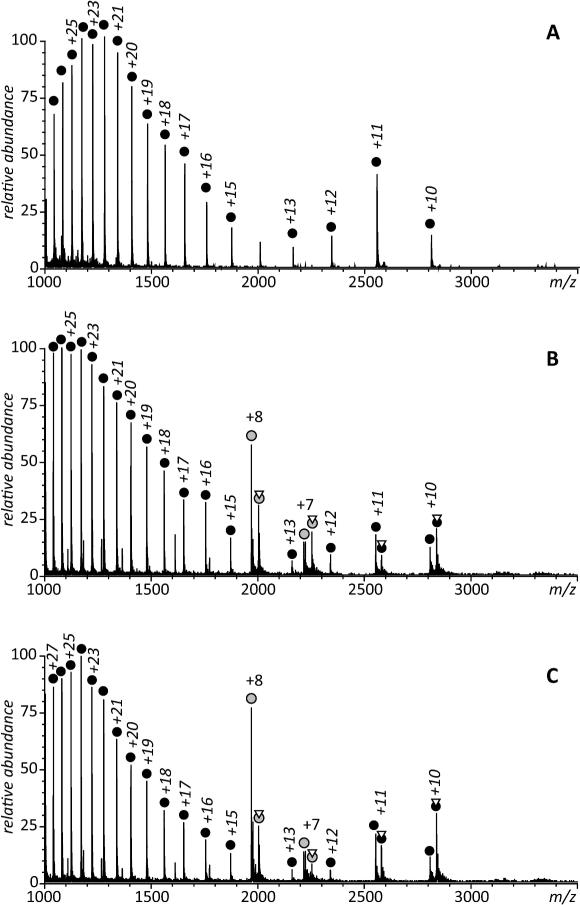
Figure 1.
ESI mass spectra of RARγ alone (A) and mixed with RA·CRABP II complex accumulated during first three minutes following mixing of the protein solutions (A) and between 10-14 min after the mixing (B). Concentration of the two proteins (in 10 mM ammonium acetate) were 10 and 20 μM, respectively. CRABP II ions are labeled with gray circles and RARγ ions are labeled with black circles; triangles indicate attachment of RA to a protein ion.

