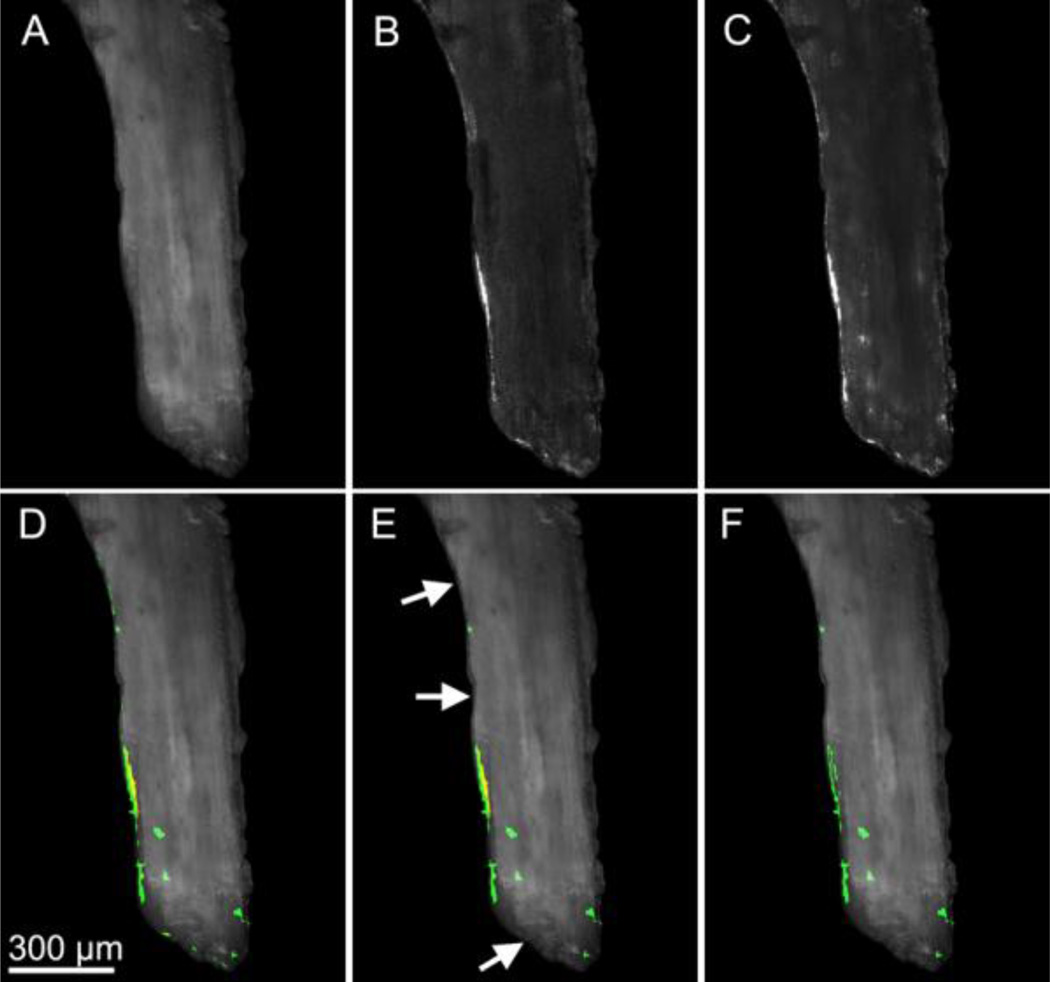
Figure 1.
Image processing associated with fluorescent microdamage stains is shown. Gray-scale images of (A) bone, (B) xylenol orange microdamage stain, and (C) calcein microdamage stain are shown. (D) Overlay images of xylenol orange and calcein show non-specific staining of the bone surface (thin lines). (E) Stain that did not extend more than 5 µm into the bone surface was classified as non-specific surface staining and was removed (arrows). (F) The true microdamage caused by loading is determined by removing regions stained with both xylenol orange and calcein.

