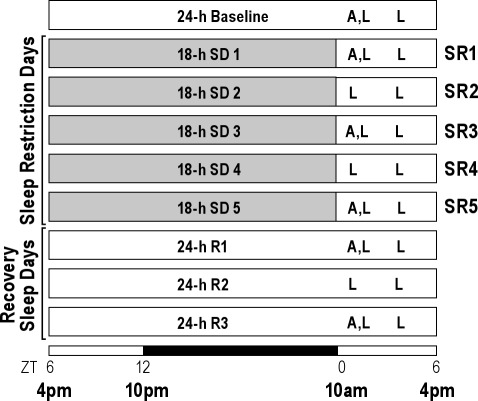
Figure 1.
Schematic diagram of experimental design. A 24-h baseline sleep-wake recording was collected beginning 6-h after light onset (zeitgeber time 6 [ZT6] = 4 PM). Over the next 5 sleep restriction days (SR1-SR5), animals were sleep-deprived (SD) for 18 h each day followed by a 6-h sleep opportunity (ZT0-6). Thereafter, animals had a 3-day unrestricted period allowing sleep recovery (R1-R3). The 12-h:12-h light-dark cycle is indicated at the bottom (open bar = light phase; black bar = dark phase). “A” represents brain tissue collection time points (ZT0) for mRNA measurements, and “L” indicates sleep latency test at ZT1 (11 AM) and ZT5 (3 PM).

