
Figure 2.
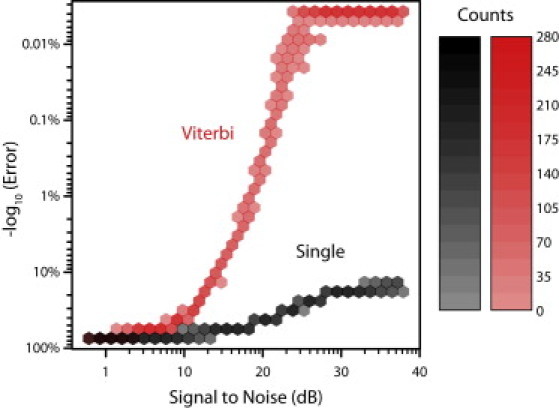
Comparison of the Viterbi method and single current measurement for different SNR levels. Individual simulations base-calling λ DNA using either the Viterbi base-calling method (red) or single current values (black) are plotted as a bivariate histogram (binned hexagonally).