
Figure 3.
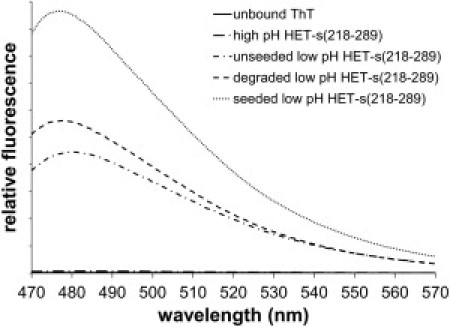
Induced ThT fluorescence on binding to several forms of HET-s(218-289) amyloid. Units of relative fluorescence intensity are arbitrary. The sample for the unbound ThT curve (almost coincident with the axis) contained no protein.
Official websites use .gov
A
.gov website belongs to an official
government organization in the United States.
Secure .gov websites use HTTPS
A lock (
) or https:// means you've safely
connected to the .gov website. Share sensitive
information only on official, secure websites.
Induced ThT fluorescence on binding to several forms of HET-s(218-289) amyloid. Units of relative fluorescence intensity are arbitrary. The sample for the unbound ThT curve (almost coincident with the axis) contained no protein.