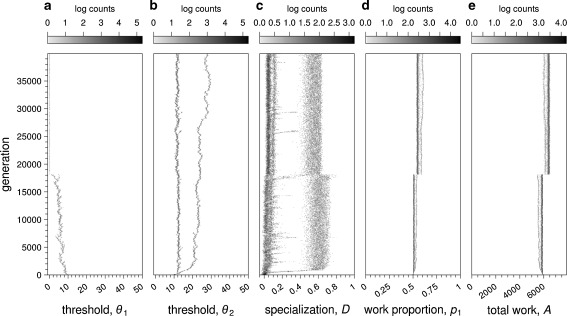
Fig. 3.
Evolutionary simulation of the response threshold model, for β = 0.75, under fitness scenario (Eq. 4) (σ = 0.1). Graphical conventions follow Fig. 2. M = 100. θ 1 decreases to zero (a) and θ 2 branches (b). A proportion of colonies shows worker specialization, with D values larger than 0.5 (c). Coinciding with the drop of θ 1 to zero, work proportion, p 1 increases slightly but does not reach the optimal value of 0.75 (d). Total amount of work, A, also increase over evolutionary time (e)

