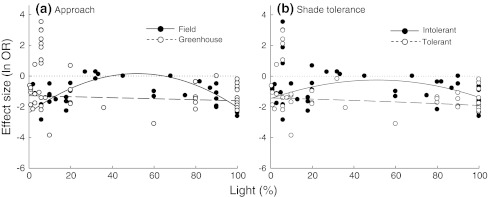
Fig. 2.
Comparison of drought effects on survival along the light gradient between groups of studies that differed in a their approach (field vs. greenhouse) and b species shade tolerance (intolerant vs. tolerant). Only those grouping variables for which differences among groups were detected are shown (see Appendix S11). Dotted lines indicate zero effect sizes

