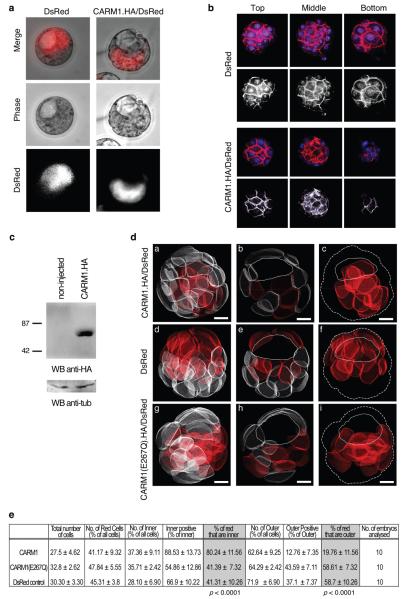
Figure 3.
CARM1 overexpression in a 2-cell blastomere results in the contribution of that cell predominantly to the ICM.
A late 2-cell stage blastomere was injected with mRNA for DsRed alone (control) or in combination with mRNA for CARM1.HA. This results in CARM1 overexpression from the mid 4-cell stage since CARM1.HA/DsRed expression starts 6-8h after injection (not shown). Embryos were cultured until the blastocyst stage and observed under fluorescence microscopy. DsRed was used as a lineage tracer.
(a) Representative embryos derived from DsRed only (n=17) or DsRed/CARM1.HA-overexpression experiments (n=35).
(b) Blastocysts were stained with phallaoidin-Texas-Red and TOTO-3 (to visualize cell membranes and DNA, respectively) and analysed under confocal microscopy. Representative top, middle and bottom sections are shown. DNA is in blue; Phallaoidin (red) can be distinguished from DsRed because the latter is exclusively cytoplasmic. The red channel is shown as grayscale. The progeny of the CARM1-overexpressing blastomere is predominantly within the inner cells of the blastocyst.
(c) Overexpression of CARM1 was verified by Western blot in zygotes injected with mRNA for CARM1.HA/DsRed.
(d) Representative 3D reconstructions of blastocysts in which mRNA for CARM1.HA/DsRed (a), Ds/Red only (d), or CARM1(E267Q).HA/DsRed (g) was microinjected at the 2-cell stage. Blastocysts were stained as in (b). Confocal z-stacks were taken at 1μm intervals. IMARIS software was used to outline cell membranes to create 3D models of all cells of the embryo. Cells were then scored according to their position: cells completely surrounded by others are denoted as inner, those with an outer surface as outer. Cells were scored as either positive or negative for DsRed. Progeny of injected blastomere is shown in red. A middle slice is shown in b,e, h where the cavity is depicted with a line. In c,f ,i, only the progeny of the injected blastomere is shown, the contour of the embryo is indicated by a dashed line and the position of the cavity by a solid line. Scale bar 10μm.

