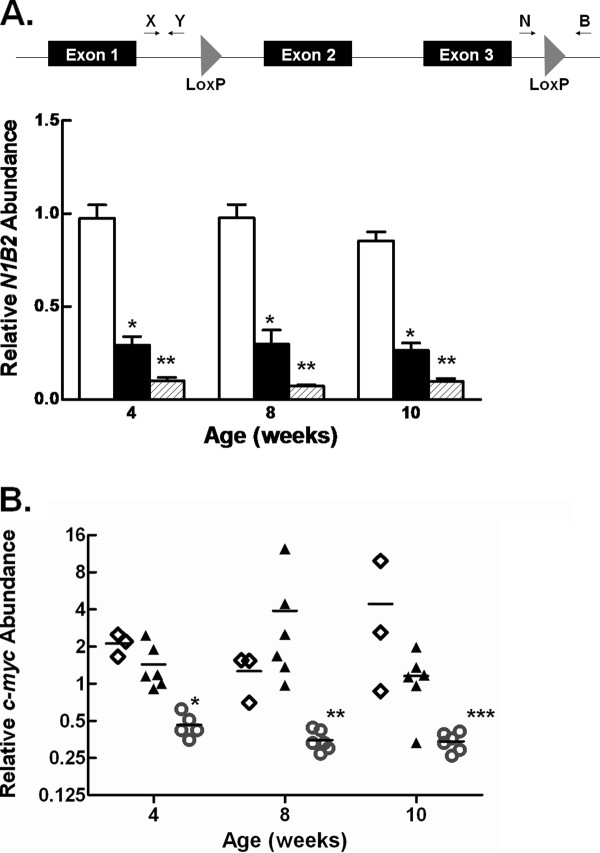
Figure 1.
Hepatic c-myc deletion in c-mycfl/fl;Alb-Cre expressing mice. A. Schematic representation of the c-mycfl allele showing location of primer pairs used in qPCR analyses to determine the relative abundance of the c-mycfl allele. The graph shows the quantification of the c-mycfl allele in liver from male and female c-mycfl/fl;Alb-Cre-/- (open bars), c-mycfl/fl;Alb-Cre+ (closed bars) and c-mycfl/fl;Alb-Cre+/+ (hatched bars) mice as described in the Methods. Data are shown as the mean + 1 SD. *, P < 0.01 c-mycfl/fl;Alb-Cre+ versus c-mycfl/fl;Alb-Cre-/- . **, P < 0.001 c-mycfl/fl;Alb-Cre+ compared to c-mycfl/fl;Alb-Cre+/+. B. Hepatic c-myc expression in male and female control and c-mycfl/fl;Alb-Cre expressing mice as analyzed by RT-qPCR. Data are shown as individual points with the mean. ◊, c-mycfl/fl;Alb-Cre-/-; ▲, c-myc+/+;Alb-Cre; ○, c-mycfl/fl;Alb-Cre. *, P = 0.001 4 wk c-mycfl/fl;Alb-Cre vs. controls; **P = 0.0004 8 wk c-mycfl/fl;Alb-Cre vs. controls; ***P = 0.0028 10 wk c-mycfl/fl;Alb-Cre vs. controls.

