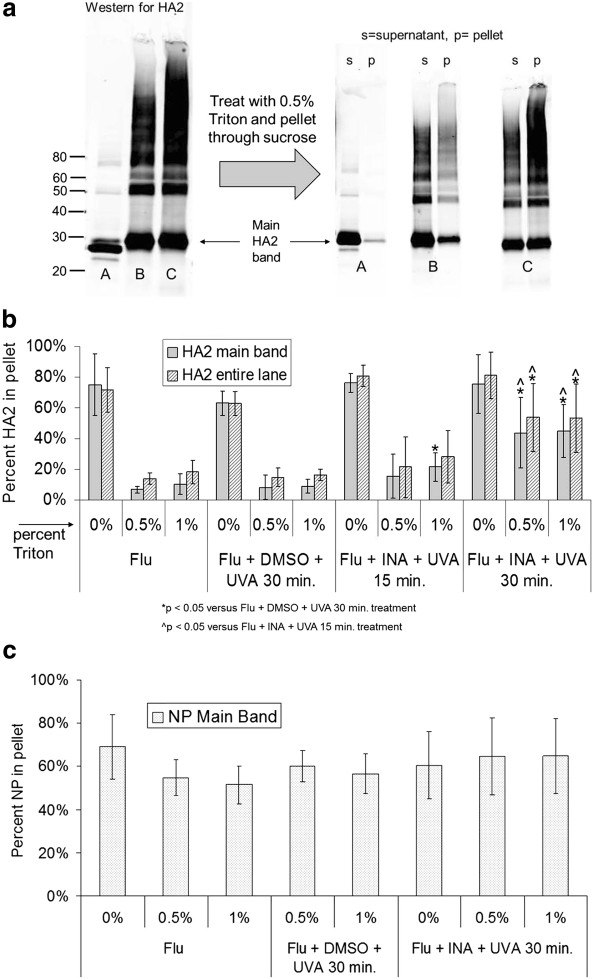
Figure 2.
Increase in the pelletable fraction of influenza PR8 hemagglutinin (HA2) after treatment of virus with INA + UVA irradiation. a) side-by-side comparison of the raw data used to determine percent HA2 in pellet showing an increase in the pelletable main band as seen by eye, where A = untreated influenza, B = influenza + INA + UVA 15 min., C = influenza + INA + UVA 30 min., b) quantitation of the percentage of HA2 in the pelleted fraction after the treatments as specified, c) quantitation of influenza nucleoprotein (NP) in the pelleted fraction. Data for b) and c) is from the integration of the entire lane in Western blot, except for those labeled "main band only" data, which represents data obtained from the integration of the main protein band (either HA2 or NP) alone (as outlined in Materials and Methods). All data was performed in true triplicate, and error bars represent plus and minus two standard deviations. P-values were calculated using a two-tailed student's T-test with unequal variances, with significant values (p < 0.05) as denoted below the figure.

