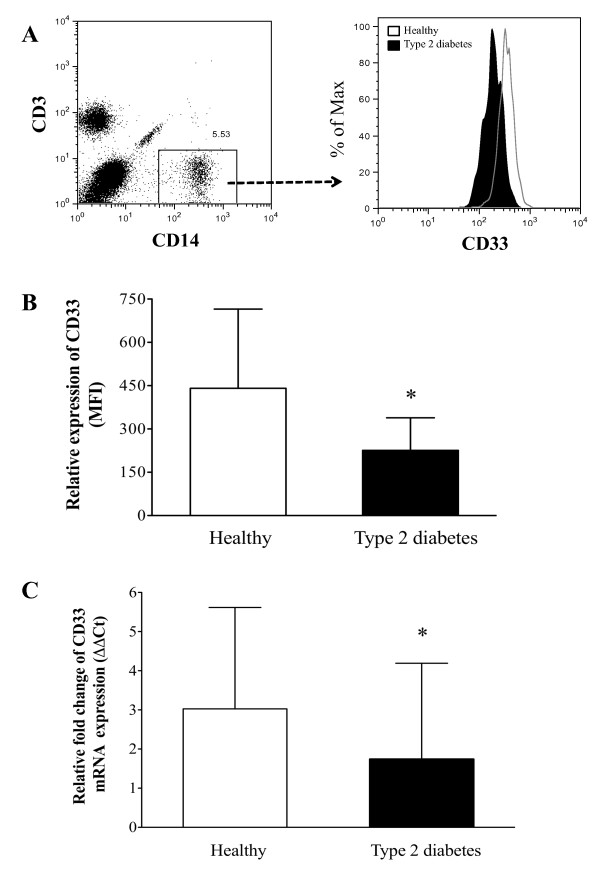
Figure 1.
CD33 expression in human monocytes from type 2 diabetes patients. (A) Monocytes were stained with anti-CD3, CD14 and CD33 mAbs. At least 50,000 events were acquired for the flow cytometry analysis. CD33 expression is shown after gating for the CD3-CD14+ cells, and a histogram of CD33 expression was plotted for type 2 diabetes patients (tinted histogram) and healthy subjects (open histogram). (B) A bar graph showing the mean intensity fluorescence (MFI) data for CD33 expression in freshly isolated monocytes from patients with type 2 diabetes (n = 10) and healthy donors (n = 10). The data are presented as the mean ± SD. * P < 0.05 compared to healthy donors. (C) Monocytes from type 2 diabetes patients (n = 9) and healthy donors (n = 8) were evaluated using Taqman gene expression analysis for CD33 mRNA expression. The results were analyzed according to the ΔΔCt method, and the data are presented as the mean ± SD. * P < 0.05 compared to healthy donors.

