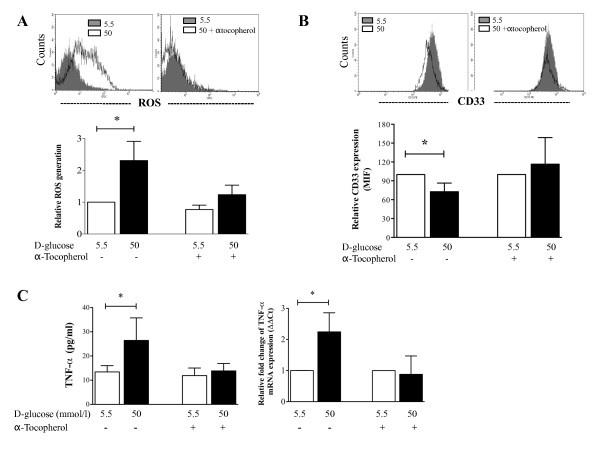
Figure 6.
The effect of α-tocopherol treatment on monocyte CD33 expression andTNF-α production. Monocytes from healthy donors were cultured in 50 mmol/l D-glucose either with or without α-tocopherol for 7 days. (A) Representative histogram of ROS generation from monocytes cultured with 5.5 mmol/l (gray) or 50 mmol/l D-glucose (open histogram) without α-tocopherol (left) or with α-tocopherol (right). The bar graph shows relative ROS generation (n = 6). (B) A representative histogram showing CD33 expression from monocytes cultured without (left) or with α-tocopherol (right). The bar graph shows the relative CD33 expression levels (n = 3). (C) Left panel, the production of TNF-α, as measured by flow cytometry. Right panel, relative fold change of TNF-α mRNA expression with and without α-tocopherol treatment (n = 3). All data are expressed as the mean ± SD. * P < 0.05 compared to treatment with 5.5 mmol/l D-glucose.

