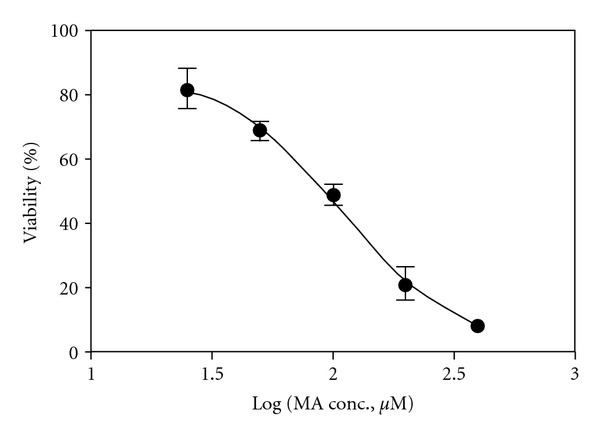
Figure 2.

The dose-response curve of neuronal cultures exposed to methamphetamine (MA) determined by MTT assay, which was generated by Prism software. The cortical neurons were exposed to various concentrations of MA (0, 25, 50, 100, 200, and 400 μM) for 48 hours.
