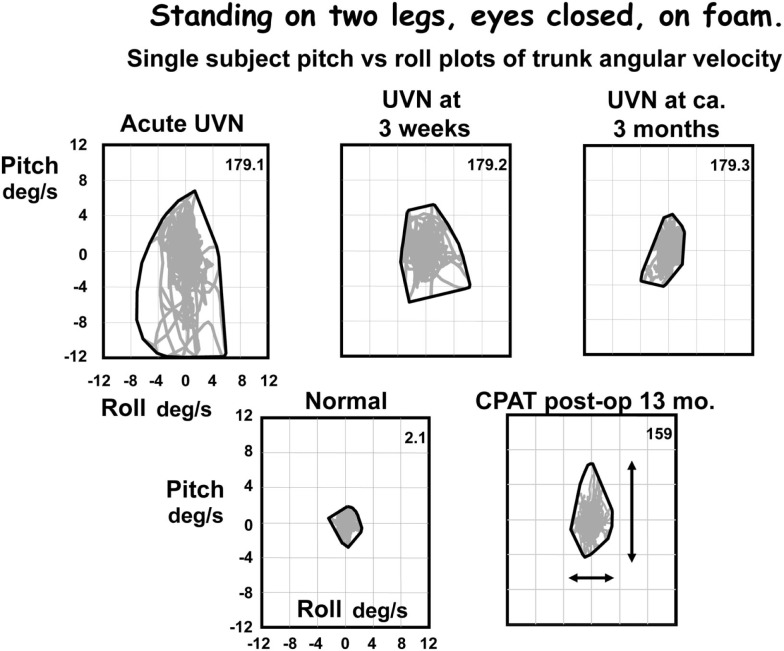
Figure 3.
Pitch versus roll plots of lower trunk (L1-3) angular velocity. The x–y plots were formed based on the pitch and roll velocities of the traces in Figure 2. Note that although the angle excursions look similar in all traces except the upper traces in Figure 2, the angular velocities are very different. Velocities for the CPAT patient at 13 months post-operatively are similar to those of the UVN patient at 3 months after acute onset. The peak to peak measures used to compare population responses in Figures 4–6 are indicated by the arrows on the CPAT x–y plot. An envelope has been drawn around the x–y traces, that is the convex hull.

