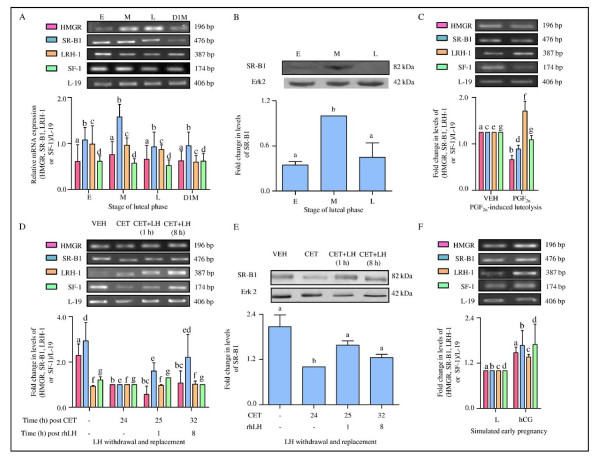
Figure 7.
Expression and characterization of genes associated with steroidogenesis/cholesterol trafficking (HMGR and SR-B1) and transcription factors (LRH-1 and SF-1) downstream of LH-LH/CGR activation. (A) Semi-quantitative RT-PCR expression of mRNA encoded by HMGR, SR-B1, LRH-1 and SF-1 genes in the CL obtained from monkeys during different stages of the luteal phase (E: early, M: mid, L: late and D1M: day 1 of menses). Each bar represents mean ± SEM values of three independent experiments. L-19 mRNA was used as internal control and relative expression was calculated following densitometric analysis. (B) Immunoblot analysis was performed to determine SR-B1 protein levels in the monkey CL collected during different stages of the luteal phase. A representative immunoblot blot along with blot probed against anti-Erk2 antibody (as protein loading control) is presented. Densitometric analysis of immunoblots was determined and is shown as mean ± SEM of SR-B1 levels relative to the intensity of Erk2 band in each stage (n = 3 animals/stage). Individual bars with different letters are significantly different (p < 0.05). (C) Semi-quantitative RT-PCR expression of HMGR, SR-B1, LRH-1 and SF-1 mRNAs in the CL obtained from monkeys 24 h after VEH/PGF2α treatment. Each bar represents mean ± SEM values of three independent experiments. L-19 mRNA was used as internal control and the fold change in levels of mRNA for each gene was calculated by densitometric analysis. (D) Semi-quantitative RT-PCR expression of HMGR, SR-B1, LRH-1 and SF-1 mRNAs in the CL obtained from monkeys post CET-induced luteolysis and rescue of CL function. Each bar represents mean ± SEM values of three independent experiments. L-19 mRNA was used as internal control and the fold change in levels of mRNA for each gene was calculated by densitometric analysis. (E) Immunoblot analysis of SR-B1 levels in the CL collected from monkeys post CET-induced luteolysis and rescue of CL function. A representative immunoblot along with blot probed against anti-Erk2 antibody (as protein loading control) is presented. Densitometric analysis of immunoblots is shown as mean ± SEM of SR-B1 levels relative to the intensity of Erk2 bands (n = 3 animals/treatment). Individual bars with different letters are significantly different (p < 0.05). (F) Semi-quantitative RT-PCR expression of HMGR, SR-B1, LRH-1 and SF-1 mRNAs in the CL collected from monkeys on day 14 of luteal phase without treatment (Late-L) or with hCG treatment to stimulate early pregnancy (hCG). Each bar represents mean ± SEM values of three independent experiments. L-19 mRNA was used as internal control and fold change in levels of mRNA for each gene was calculated by densitometric analysis.

