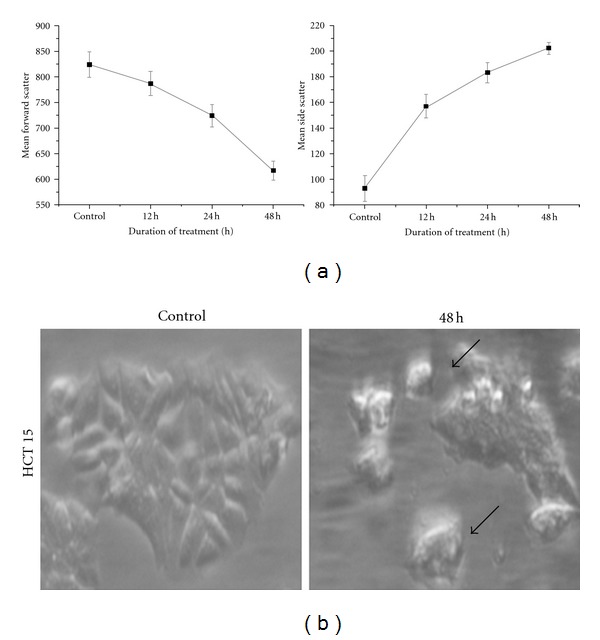
Figure 2.

Changes to cell size and granularity distribution of caffeic-acid-treated cells. (a) Flow cytometric determination of cell forward and side laser light scatter was used to determine the relative changes to cellular size and granularity of HCT 15 cells after 12, 24, and 48 h of caffeic acid treatment. Data are mean ± S.E from the three independent experiments. (b) Photomicrograph of caffeic-acid-treated cells was acquired along with the untreated control cells after 48 h. Treated cells showed shrinkage compared to the normal cells as shown by arrow mark.
