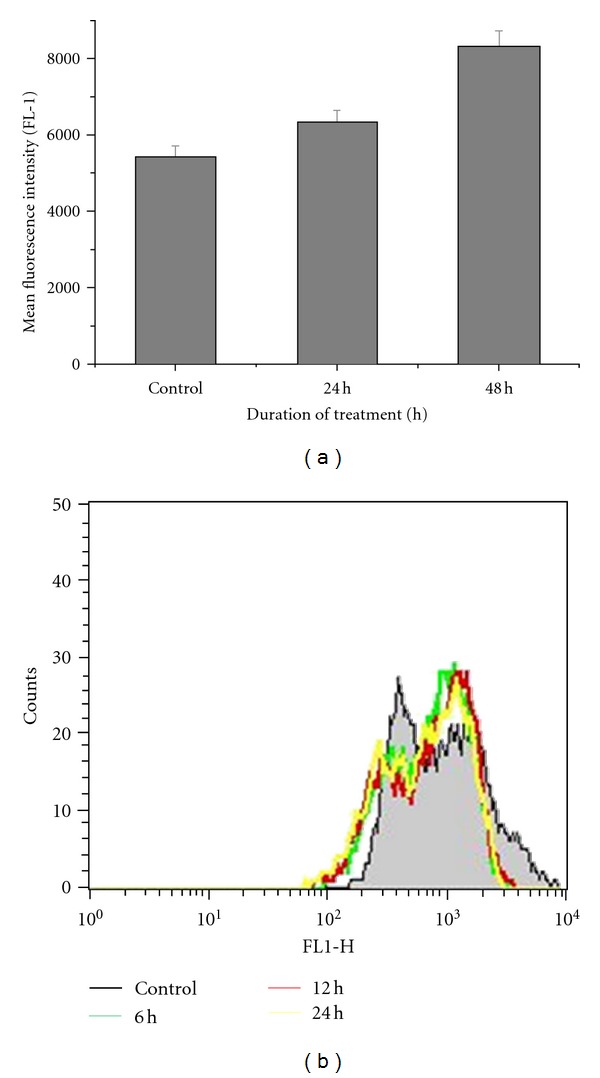
Figure 3.

ROS generation and mitochondrial membrane potentials (Ψm) of caffeic-acid-treated cells. (a) HCT 15 cells were cultured in the presence or absence of caffeic acid for the specified time points. DCFDH-DA fluorescence intensity was detected by using flow cytometry. Data shows the mean and standard error of three independent experiments. (b) HCT 15 cells were treated with caffeic acid for specified time-periods and then Ψm were determined using rhodamine 123 by flow cytometry. Data is representative of three independent experiments.
