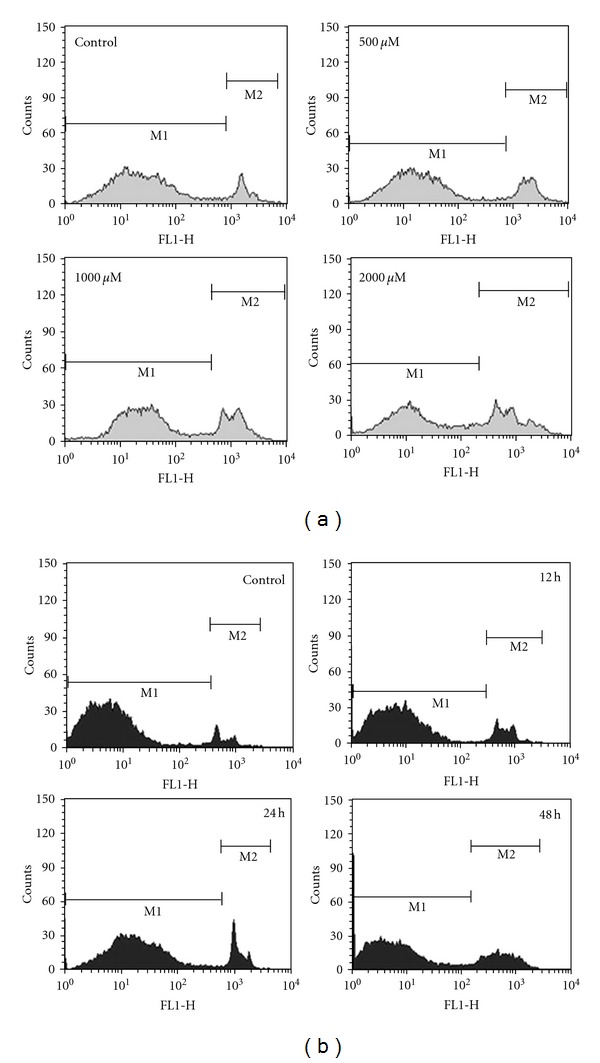
Figure 4.

Apoptosis evaluation using Yo-Pro-1 dye by flow cytometry. (a) HCT 15 cells were treated with different doses of caffeic acid for 48 h. The distribution of cell population changed according to the doses as indicated by M1 and M2. Percentage of M2 population depicting apoptosis increased depending upon the increasing dose. Data is representative of three independent experiments. (b) HCT 15 cells were treated with caffeic acid for specified time points. The distribution of cell population changed according to the exposure time as indicated by M1 and M2. Percentage of M2 population depicting apoptosis increased on the basis of the duration of treatment. Data is representative of three independent experiments.
