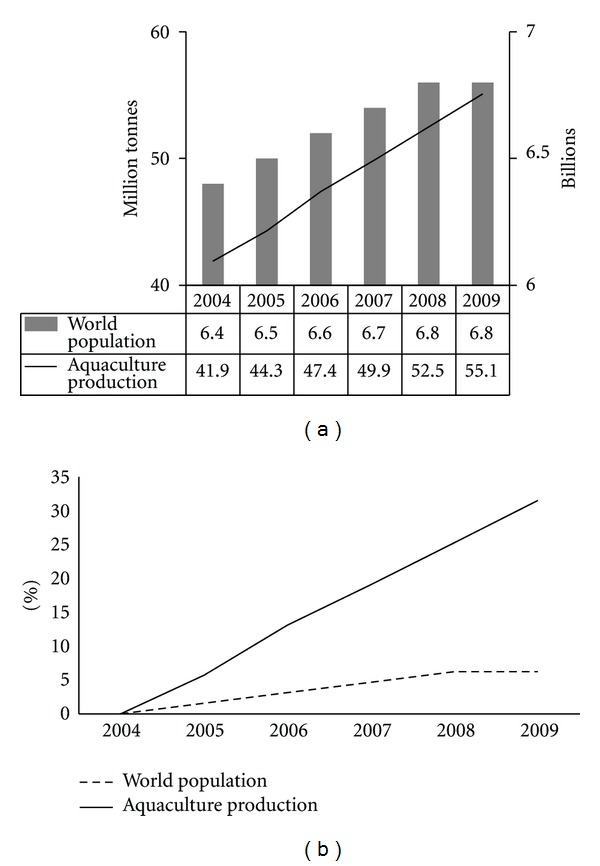
Figure 1.

Growth behavior of world population and aquaculture production during the last six years. (a) illustrates the total world population by year (billions) and the total production of aquatic organisms by aquaculture (million tonnes). (b) compares the percentage of annual increase of world population and aquaculture production, considering year 2004 as the basepoint. Data obtained from FAO Report 2010: World Review of Fisheries and Aquaculture.
