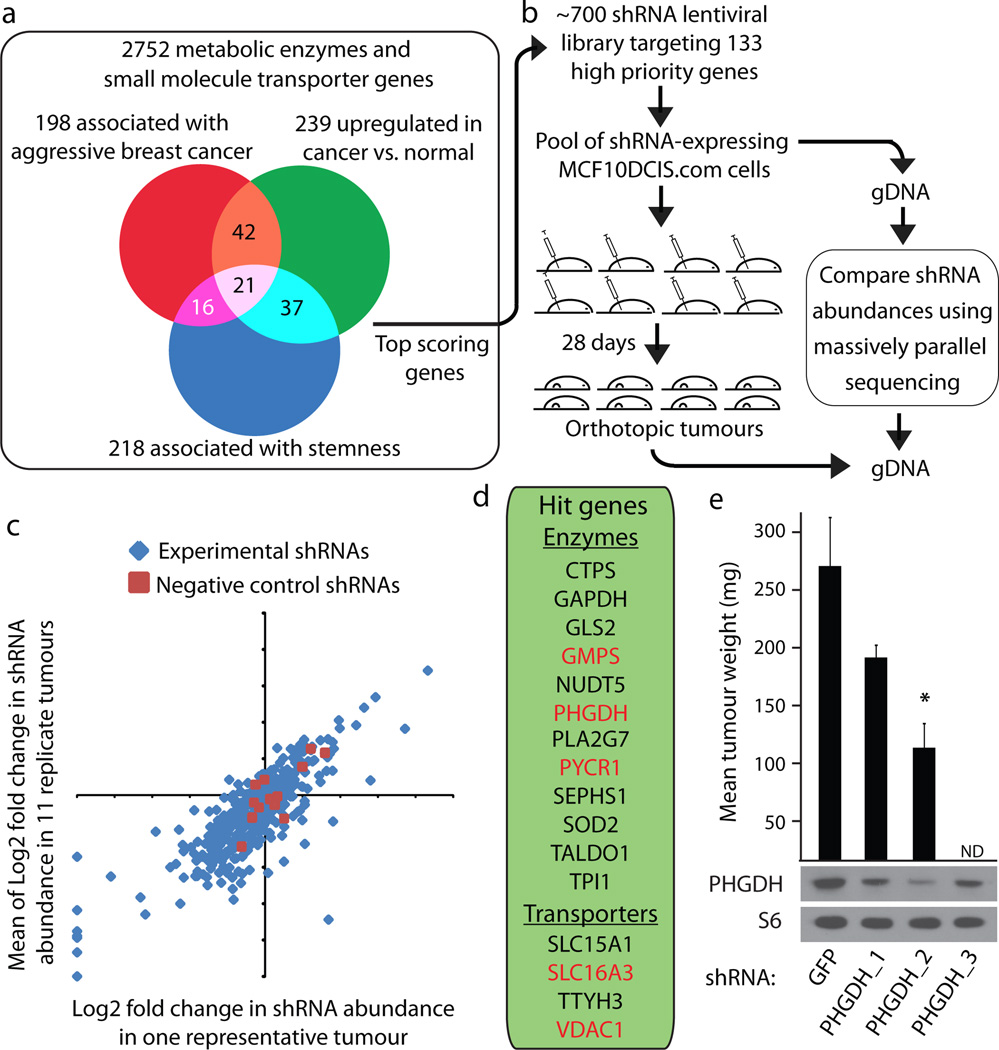
Figure 1. Outline of in vivo pooled screening strategy identifying PHGDH as essential for tumourigenesis.
a, Venn Diagram outlining meta-analysis. b, Outline of experimental design. c, Log2 fold change in shRNAs abundance of experimental (blue) or neutral shRNAs (red) for a single tumour (X-axis) compared to an average of eleven tumours (Y-axis). d, Genes scoring in vivo. e, Average weight of tumours from MCF10DCIS.com cells expressing shRNAs targeting PHGDH (PHGDH_1, PHGDH_2 and PHGDH_3) or control (GFP) and protein expression of PHGDH or RPS6 (S6). Error bars are SEM (n=4). Asterisks indicate probability value (p) < 0.05. ND = Not Done.

