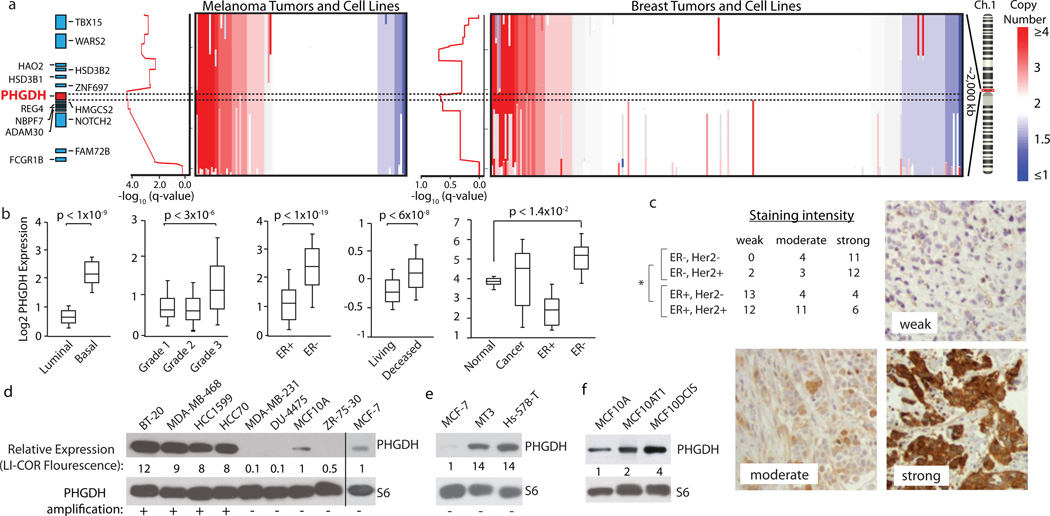
Figure 2. Genomic amplifications of PHGDH in cancer and association of PHGDH expression with aggressive breast cancer markers.
a, PHGDH vicinity copy number (CN) data for melanoma (left, n=111) and breast cancer (BC, right, n=243) samples. Coloured bar indicates degree of CN loss (blue) or gain (red). Samples sorted by CN at PHGDH locus (dotted lines). Graphs at left of CN data shows amplification significance (−log10(q-value), ~0.60 is the significance threshold for amplification). b, Representative PHGDH gene expression data for indicated BC groups. Whiskers indicate 91st and 9th percentile. c, Table reports numbers of human BC samples with “weak”, “moderate”, or “strong” PHGDH staining from BC subgroups indicated. Representative staining intensities shown in images. Asterisk indicates p<0.0001 comparing ER-positive versus ER-negative classes (Fisher’s exact test). d–f, PHGDH protein levels are shown for (d) PHGDH amplified versus non-amplified (annotated with “+” or “−“), (e) PHGDH non-amplified, over-expressing, and (f) MCF10A derived cell lines. Values below PHGDH immunoblots are normalized immunoflourescent quantification (LI-COR) of PHGDH levels relative to actin control and MCF10A and MCF7.

