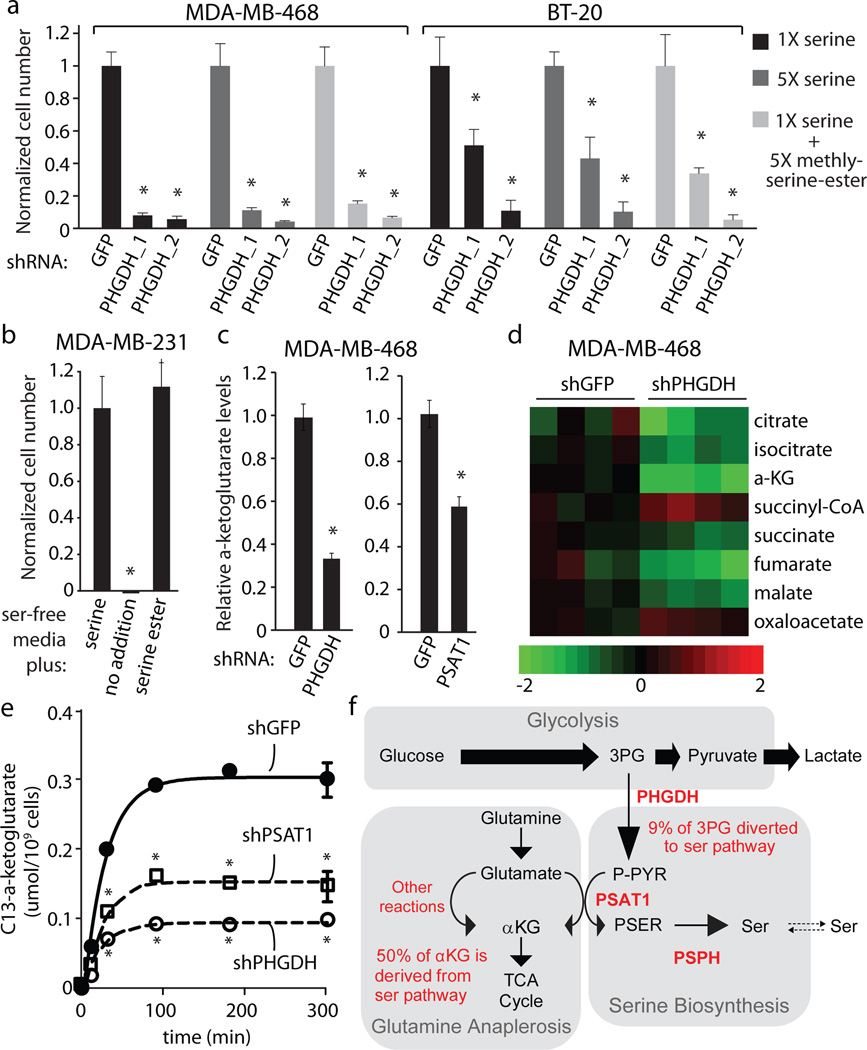
Figure 4. Suppression of PHGDH results a deficiency in anaplerosis of glutamine to alpha-ketoglutarate.
a, Relative proliferation of cell lines indicated expressing control shRNA (GFP) or shRNAs against PHGDH (PHGDH_1 and PHGDH_2) after seven days of growth under conditions indicated. b, Relative proliferation of MDA-MB-231 cells under conditions indicated. c, Intracellular alpha-ketoglutarate (aKG) four days after treatment with shRNA against PHGDH or PSAT1 cell number normalized relative to control shRNA (GFP). d, Citric acid cycle intermediate levels four days after treatment with shRNA against PHGDH or GFP (n=4). Color bar shows Log2 scale. e, aKG isotopic labeling at indicated time points after treatment with isotopically labeled glutamine four days after treatment with shRNA against PHGDH, PSAT1 or GFP. f, Model of relative metabolite fluxes for indicated pathways. Asterisks indicate p < 0.05 relative to control. Error bars indicate SEM (n=4).

