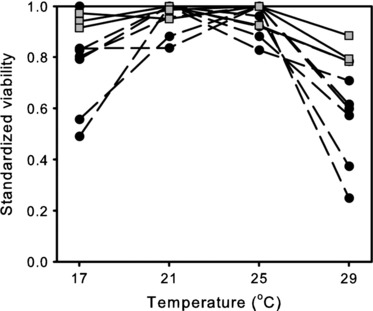
Figure 1.

Viability of inbred (black circles, broken lines) and noninbred (gray squares, solid lines) populations of Drosophila melanogaster at four different temperatures. For each population, the viability is scaled for each temperature relative to the highest viability observed for that population. The highest viability was set at 1 for each population (from Joubert and Bijlsma 2010).
