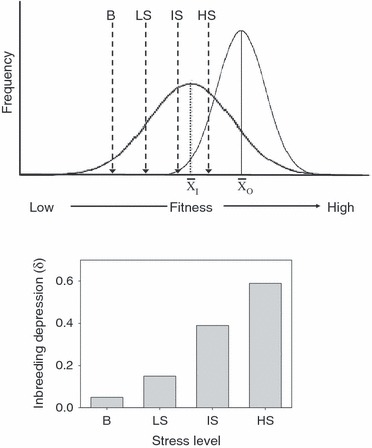
Figure 3.

Top: Schematic diagram depicting fitness distributions for inbred individuals (left curve with mean xi) and outbred individuals (right curve with mean xo). The vertical lines represent the threshold values for the hard selection below which individuals do not survive for four different stress levels: benign (B), low stress (LS), intermediate stress (IS) and high stress (HS). Bottom: Amount of inbreeding depression (δ) expected at the four stress levels, B, LS, IS and HS. From the top figure survival rates were estimated to be 0.95, 0.85, 0.60 and 0.35 for the inbred individuals and 1.00, 1.00, 0.99 and 0.85 for the outbred individuals for the four respective stress levels, and these rates were used to calculate the expected level of inbreeding depression as: δ = (survival outbreds − survival inbreds)/(survival outbreds).
