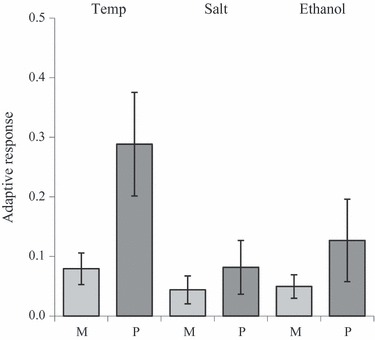
Figure 5.

Mean adaptive response (±SE) after six generations of adaptation at three stress environments, temperature stress (Temp), salt stress (Salt) and ethanol stress (Ethanol) for fragmented (M) and nonfragmented (P) populations of Drosophila melanogaster. The adaptive response for each population was calculated as the difference in viability of adapted flies minus the viability of nonadapted flies for each population at each stress (from Bakker et al. 2010).
