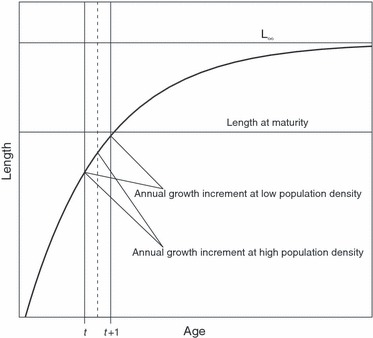
Figure 1.

A schematic illustration of the use of von Bertalanffy (VB) growth curves in the simulation model. Individuals were assumed to mature at a body size that was 66% of L∞. At optimal growth conditions (i.e., low population density), an individual's progress along its VB curve according to its age increase from t to t + 1, whereas at high population density, resources allocated to growth were limited and progress along the VB curve was reduced from that at the optimal conditions.
