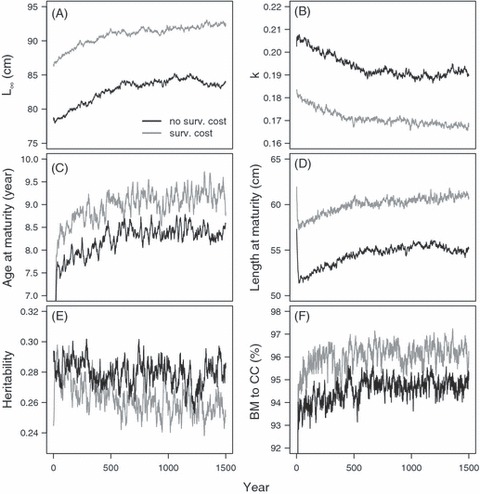
Figure 2.

Illustration of simulation runs and the effect of the survival cost of reproduction on the adaptation of two cod populations. In the first scenario (gray line; survival cost), the overall natural mortality is split into two components: natural mortality experiences by all individuals (M) and the survival cost of reproduction (SC) both of which were set to 0.1. In the second scenario with no survival cost of reproduction (black line), M is set to the average of the overall mortality over the last 100 years in the first simulation scenario, so that M = 0.132. Therefore, the overall (instantaneous) rate of natural mortality is equal in both the simulation scenarios, but in the first scenario, immature fish experience mortality lower than the average, and mature fish experience higher mortality than the average. In contrast, in the second scenario, mortality experience by all the fish is the same. The panels show the average von Bertalanffy parameters (A) L∞, (B) k, (C) average age, (D) length at maturity, (E) heritability of the growth strategy (see Methods for further details), and (F) the biomass to carrying-capacity ratio.
