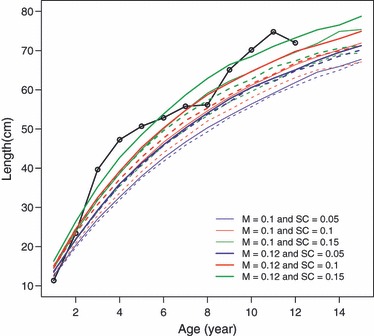
Figure 3.

Average length-at-age measured from cod otoliths (black solid line with bullets) and average length-at-age predicted by the simulation model. In simulations, the averages are calculated over eight recording points at 10-year intervals in the adapted population (last 100 years of simulated 1500 years). Natural mortality (M) and survival cost of reproduction (SC) scenarios are given in the legend. Dashed lines show predictions for the simulation scenarios, where the overall rates of mortality are the same as in the scenarios indicated in the legend but with no survival cost of reproduction, so that mortality does not differ between immature and mature individuals.
