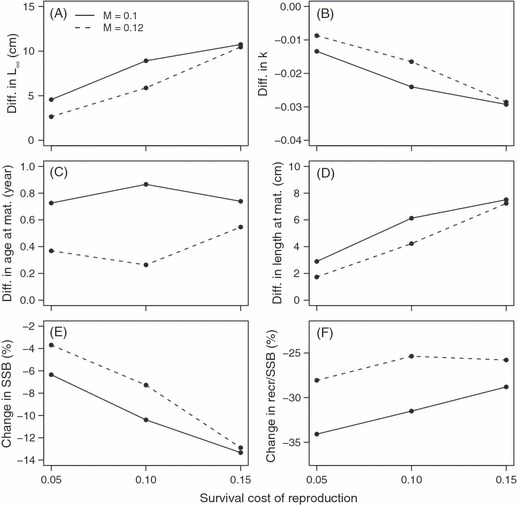
Figure 4.

Differences in life-history traits and population characteristics owing to the survival cost of reproduction (SC). These were obtained by comparing two simulation runs with the same rate of overall mortality but either mortality being equal among immature and mature individuals (no SC) or increased among mature (due to SC). The differences were calculated by reducing an average value in the simulation run without SC from the average in the simulation run with SC. Both averages are calculated from the adapted populations, so over the last 100 years of the simulated 1500 year. Survival costs of reproduction are indicated in the x-axis, while the natural mortality experienced by all individuals (M) is given in legend. Differences are given for (A) L∞, (B) k, (C) average age, and (D) length at maturity. Panels (E) and (F) give relative differences in the spawning stock biomass (SSB) and the recruits-per-spawner ratio (recruits/SSB), respectively, between the simulations with and without SC. For example, panel A indicates that at every combination of M (line type) and SC (x-axis), L∞ is higher in the presence of SC compared to the simulation without SC (the difference is always >0).
