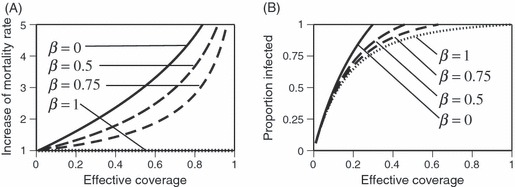
Figure 2.

Evolutionary predictions. The lines show, as a function of effective coverage, the effect of the biopesticide on the mortality of insecticide-resistant mosquitoes where the reproductive successes (estimated as expected longevity, see Materials and methods) of resistant and sensitive mosquitoes are equal. Above the line, the success of resistant mosquitoes is lower than that of sensitive ones, so the evolution of resistance is blocked. In both panels, the lines shows the situation where the biopesticide has no effect on the expression of resistance (β = 0, solid line), sensitivity is partially restored (β = 0.5 or 075, long- and short-dashed lines), and where sensitivity us completely restored, i.e., genetically resistant mosquitoes are as sensitive as genetically sensitive mosquitoes (β = 1, dotted line). (A) The extent to which the biopesticide must increase mortality rate (decrease longevity) of resistant mosquitoes to block resistance, if all mosquitoes can be infected by the biopesticide. (B) The proportion of the mosquitoes that must be infected by the biopesticide to block resistance, if the biopesticide increases the cost of resistance two-fold (γ = 2).
