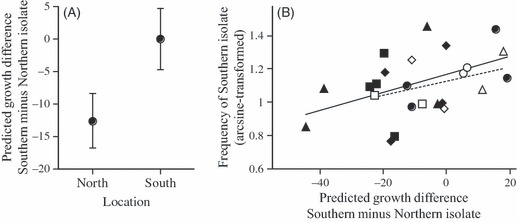
Figure 5.

(A) Mean predicted cumulated growth differences between competing southern and northern isolates in the southern and northern location. Means and standard errors calculated over competing pairs of isolates, years and host cultivars. (B) Relationship between predicted growth differences and the observed final frequency of southern isolates in the field experiment. Open symbols denote the field location in the south of France and filled symbols the location in the north. Different symbols refer to the four different pairs of competing isolates, pooled over the two host cultivars and field seasons. The two regression lines illustrate the relationship in the southern location (dotted line) and in the northern location (solid line).
