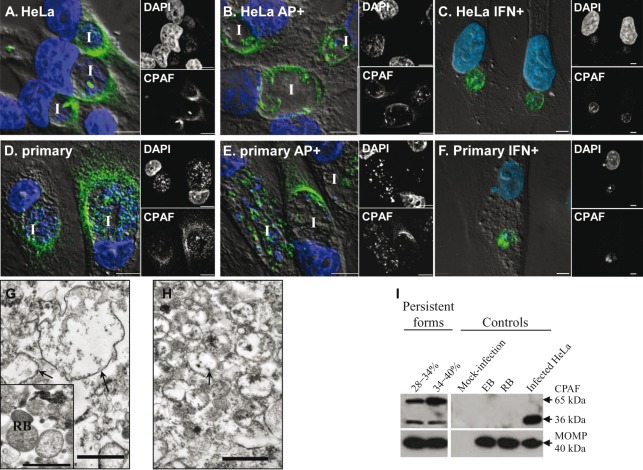
Fig. 3.
Localization of CPAF protein in C. trachomatis-infected cells. Infected HeLa cells (A–C) and primary endocervical cells (D–F) cultured in the absence or presence of persistence inducers (ampicillin, AP+; or IFN-γ, IFN+) as indicated were fixed at 36 h p.i. and immunostained with anti-CPAF antibody 100a. Overlays of DIC, CPAF (green) and DAPI (blue) images are shown in the large panels to the left, with separate small images of the single channels to the right. I, inclusion. Scale bars, 5 µm. (G, H) Representative TEM images of persistent forms isolated from C. trachomatis-infected HeLa cells exposed to ampicillin at the 28–34 % Renografin interface (G) and the 34–40 % Renografin interface (H). The control image of isolated normal RBs is shown in the inset in (G). Representative persistent forms are indicated by arrows. Note the difference in electron density between normal RBs and the persistent forms. Scale bars, 1 µm. (I) Immunoblot analysis of isolated C. trachomatis forms against CPAF. Lysates of isolated persistent forms at the 28–34 % and 34–40 % interfaces (left panels), and control RBs and EBs (right panels), were fractioned by SDS-PAGE, followed by immunoblotting with anti-CPAF antibody 100a and anti-MOMP antibody. Mock-infected and C. trachomatis-infected cells were used as negative and positive controls. Each panel is representative of at least three independent experiments.

