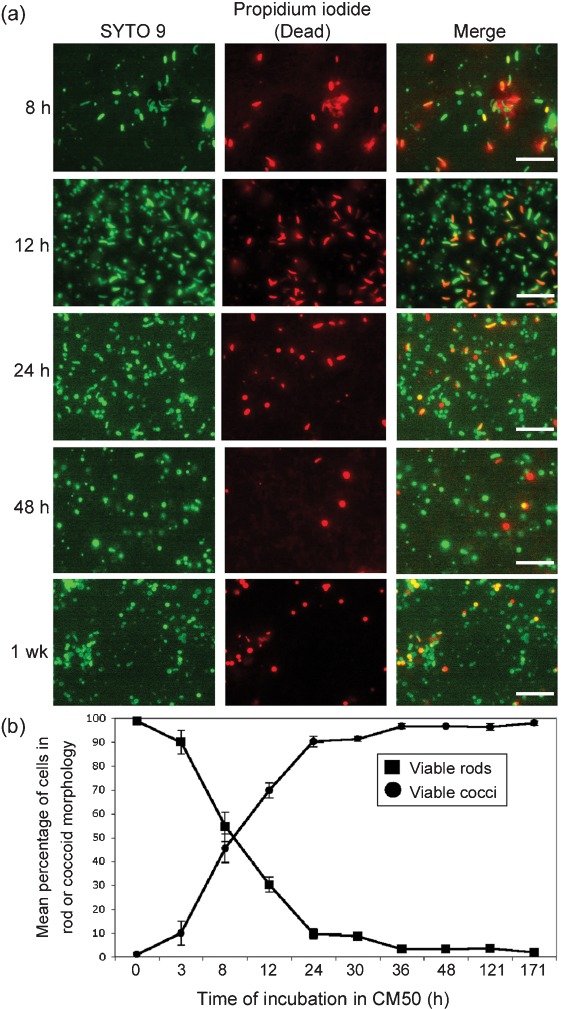
Fig. 3.
Fluorescence microscopy visualizing the morphology and viability of V. cholerae over time. (a) BacLight was used to distinguish viable from dead V. cholerae in coccoid and rod morphologies after 8, 12, 24 and 48 h, and 1 week of incubation in CM50. The green fluorescence stains all cells, and the red fluorescence represents cells that are non-viable. Bars, 7.5 µm. (b) Graphic representation of the change in the percentage of viable cells in coccoid and rod morphology over time. Results shown are mean and sd.

