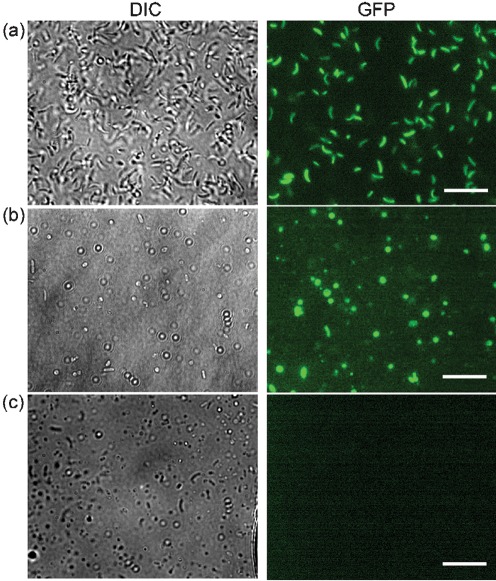
Fig. 7.
Visualizing expression of ToxT using fluorescent microscopy. (a) Differential interference contrast (DIC) and GFP fluorescence images of V. cholerae at 0 h in CM50 with the promoter of toxT fused to GFP (promoterToxT : GFP) (SJK166, positive control). (b) DIC and GFP images of SJK166 incubated for 48 h in CM50. The presence of GFP indicates that ToxT is being expressed. (c) DIC and GFP images of ΔtoxR/promoterToxT : GFP incubated for 48 h in CM50 (SJK174, negative control). Bars, 7.5 µm.

