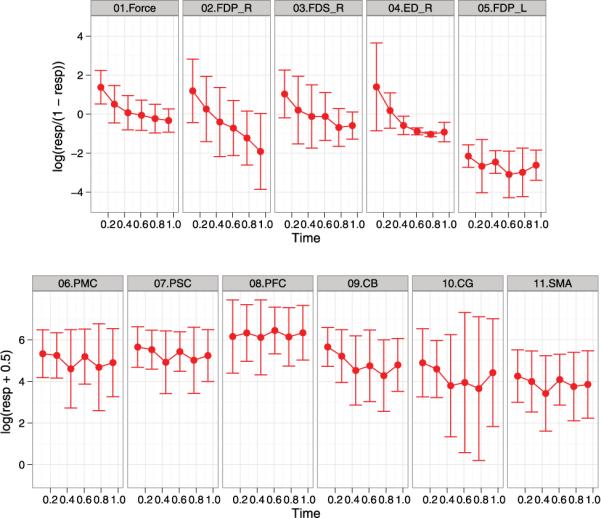
Figure 2.

Summarized longitudinal data with transformations (logistic transformation for percentage outcomes and logarithm transformation for count outcomes). Each panel shows a plot of the mean with the standard deviation over the normalized time for a transformed response. There is the downward trend for the force and the EMG percentages of FDSR, FDPR, and EDR. In contrasts, there is no strong downward trend in the fMRI counts and the EMG percentage of FDPL.
