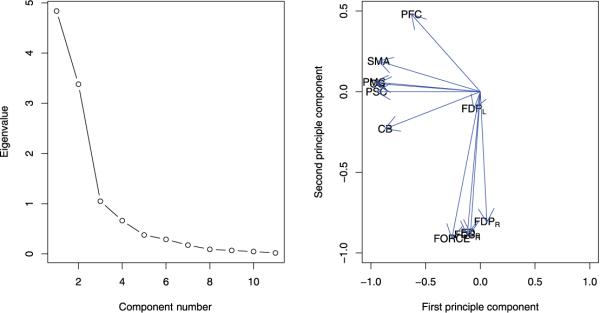
Figure 3.
The graphical results for the principal component analysis (PCA) of the correlation matrix: the left panel displays the scree plot; the right panel shows that the first principle component score versus the second principle component score. The scales referring to the outcomes from electromyography (EMG) in the right arm and the force were grouped together, while the scales referring to the outcomes from functional magnetic resonance imaging (fMRI) were far from the scale of the force.

