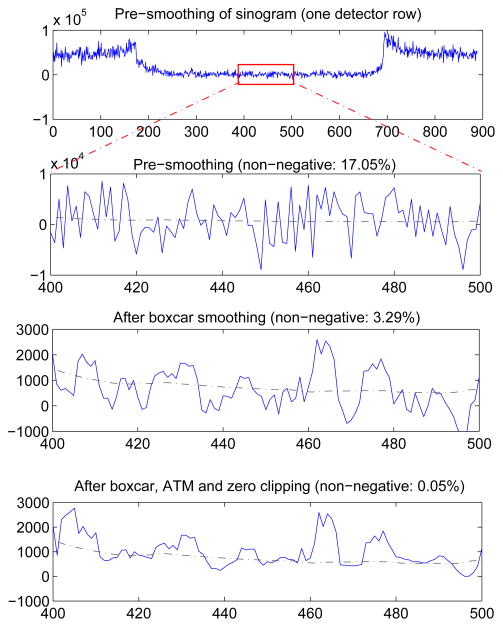
Figure 7.
Detailed profile of sinogram after dark current subtraction in each processing step. The sinogram was generated with CT technique of 1 mA, 120 kVp, 0.5 mm Cu filtration. The sinogram was smoothed by a 5 × 5 boxcar, followed by ATM smoothing and zero clipping. Note the x- and y-axis scale changes. The dashed line is the reference noise-free CT sinogram profile for comparison.

