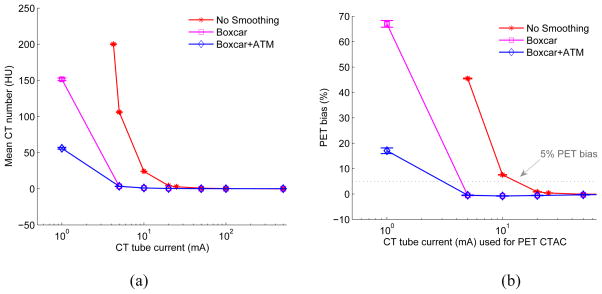
Figure 8.
(a) Comparison of CT bias (mean CT number in HU) as a function of CT tube current with and without sinogram smoothing for 20 i.i.d elliptical water cylinder phantom. (b) Corresponding comparison of PET bias (%) as a function of CT tube current for the 20 i.i.d elliptical water cylinder phantom with and without CT sinogram smoothing. The standard error of the mean is shown as error bar. The dotted line shows 5% PET bias. It can be seen that 2D 3×3 boxcar sinogram smoothing could reduce CT dose for matched PET bias, boxcar followed with ATM could further reduce CT dose. Note that lower range of no smoothing case is truncated if the corresponding PET bias is higher than 70%.

