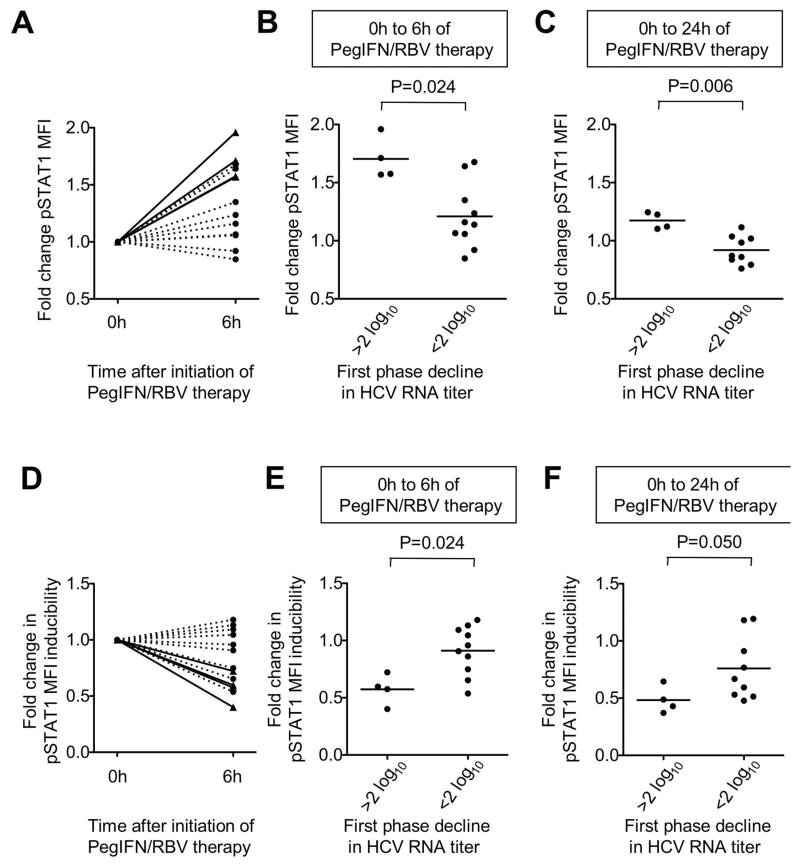
Figure 5. Correlation of pSTAT1 expression and first phase virological response.
(A) Fold change in in vivo pSTAT1 expression by CD3-CD56+ NK cells during the first 6h of PegIFN/RBV therapy in individual patients with (solid lines) and without (broken lines) a greater than 2 log10 first phase decline in HCV RNA titer.
(B–C) Fold change in in vivo pSTAT1 expression by CD3-CD56+ NK cells during the first 6h (B) and 24h (C) of PegIFN/RBV therapy in individual patients with and without a greater than 2 log10 first phase decline in HCV RNA titer.
(D) Fold change in pSTAT1 inducibility (pSTAT1 MFI after in vitro treatment with IFN normalized to in vivo levels prior to (0h) or 6h after initiation of PegIFN/RBV therapy) in individual patients with (solid lines) and without (broken lines) a greater than 2 log10 first phase decline in HCV RNA titer.
(E–F) Fold change in pSTAT1 inducibility in NK cells (pSTAT1 MFI after in vitro treatment with IFN normalized to in vivo levels prior to (0h) or 6h (panel E) or 24h (panel F) after initiation of PegIFN/RBV therapy) in individual patients with and without a greater than 2 log10 first phase decline in HCV RNA titer.

