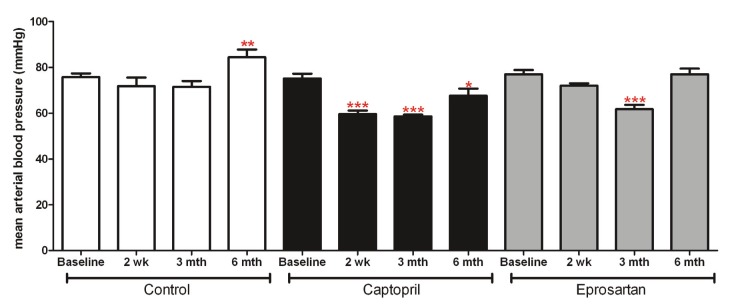
Figure 1.
Mean Arterial Blood Pressure (MABP): data represent mean ± sem of MABP measured in control, captopril and eprosartan treated animals at baseline and at 2 weeks, 3 and 6 months of treatment. Preliminary analysis with 1 -way ANOVA and Dunns multiple comparison post-hoc test demonstrated that there were no significant differences between the groups at baseline. Data within each treatment group were analysed using repeated measures 1-way ANOVA, with Newman-Keuls multiple comparisons post-hoc test. * indicates significantly different from baseline (p<0.05, **p<0.01, ***p<0.001)

