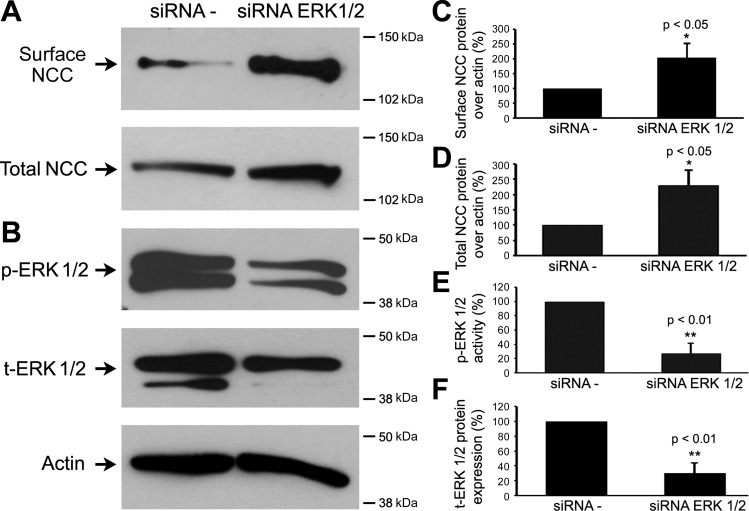
Fig. 5.
Knock-down ERK1/2 expression increased NCC total and surface protein expressions. mDCT cells were transfected with scramble siRNAs (siRNA −) or siRNA ERK1/2. Cell surface biotinylations and Western blot were subsequently performed. A and B: representative immunoblots are shown for surface and total NCC protein levels (A) and phospho-ERK1/2 and total-ERK1/2 (B). C and D: bar graphs represent the summary data for 3 independent experiments for surface and total NCC protein levels, respectively. E and F: bar graphs represent the summary data of 3 independent experiments for phosphor-ERK1/2 and total ERK1/2 levels, respectively. Cell surface and total NCC levels were significantly increased in the siRNA ERK1/2 group compared with the siRNA − control group. Phospho- and total ERK1/2 levels were significantly decreased in the siRNA ERK1/2 group compared with the siRNA − group. The molecular weight markers are indicated at the right side of the blots. *P < 0.05 and **P < 0.01, n = 4.

