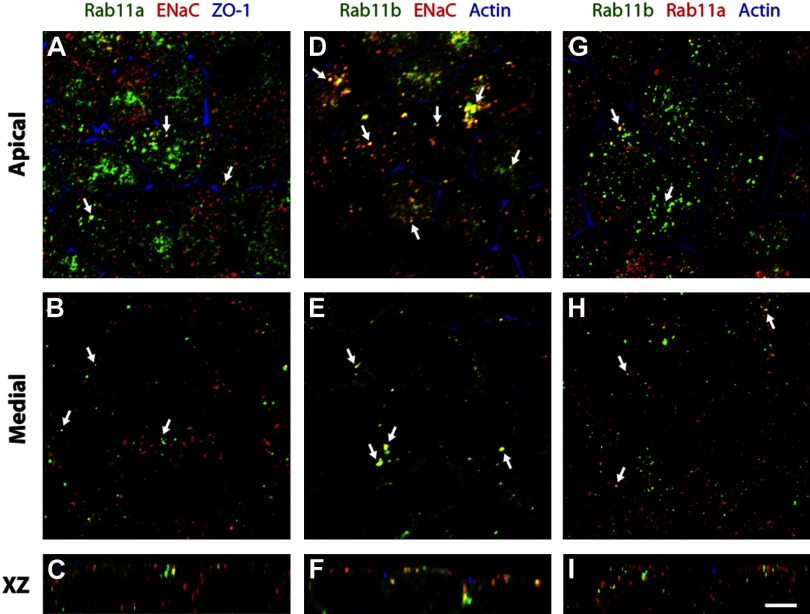
Fig. 2.
Distribution of Rab11 and ENaC in mpkCCD cells. A–C: distribution of Rab11a (green), α-ENaC (red), and the tight junction-associated protein zonula occludens (ZO)-1 (blue). D–F: distribution of Rab11b (green), α-ENaC (red), and actin (blue), which is concentrated at the apicolateral junction of the cells. Actin is also found in the cortical region along the basolateral surfaces of the cell (and associated with microvilli), but this staining is not apparent in these images. G–I: localization of Rab11b (green), Rab11a (red), and actin (blue) in mpkCCD cells. Images were acquired with a confocal microscope, and projections of 3 optical sections from the apical or medial planes of the monolayers or individual xz sections are shown. Scale bar = 5 μm.

