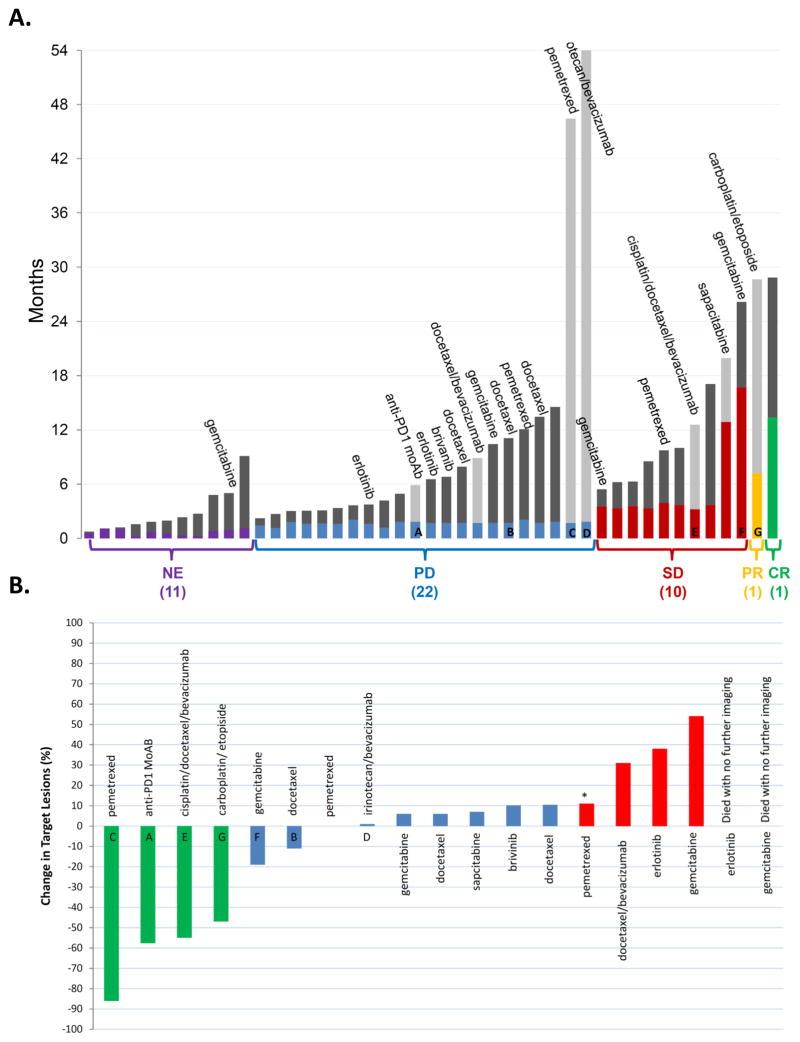
Figure 4. Survival, subsequent therapies, and response.
A Duration of survival on and after protocol therapy. The height of the gray bar indicates duration of survival. Light gray bars indicate patients who are still alive. The colored portion of the bar represents the duration of therapy received on trial. NE: non-evaluable for response, PD: progressive disease, SD: stable disease, PR: partial response, CR: complete response. If a patient received subsequent chemotherapy within 6 months, it is listed above the patient’s survival bar. Letters identify corresponding patients in panel B. B. Waterfall plot of response to immediate subsequent therapy. The best change in defined target lesions to subsequent systemic anti-cancer treatment following epigenetic therapy is shown. Green: PR, blue: SD, red: PD. (*) indicates progression defined by a new lesion. Two patients, indicated at right, died without follow-up imaging.

