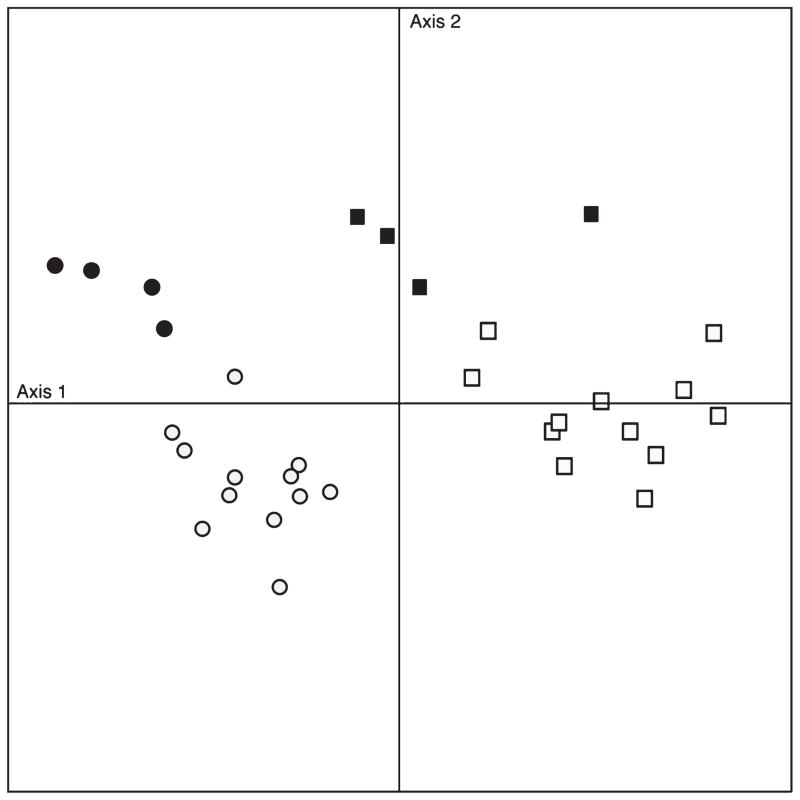
Figure 2.
Principal component analysis (PCA) of the top 40 extreme microbial species of irritable bowel syndrome (IBS)-induced and control rats. IBS luminal matter samples are indicated in open squares and IBS mucosal samples are closed squares. Control luminal matter samples are indicated in open circles and IBS mucosal samples are closed circles. X-axis represents the abundance of species, axis Y represents the community composition.

