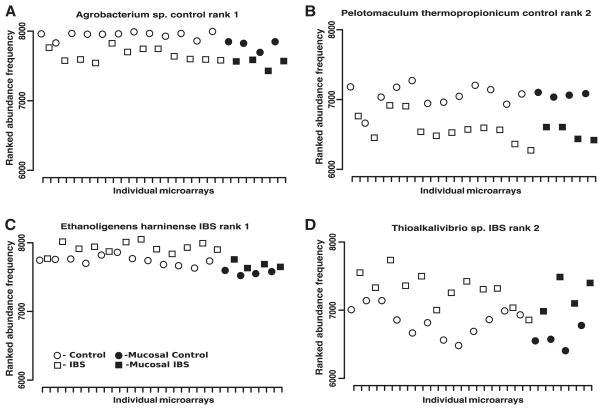
Figure 4.
Paired ranked difference plots of the top two control and irritable bowel syndrome (IBS) species. The x-axis indicates the individual samples. The y-axis shows the paired ranked difference in species abundance, highest rank being 8300 and lowest 6000, of the corresponding control and IBS samples. Plots (A) & (B) show the first and second ranked control species. Plots (C) & (D) show the first and second ranked IBS species.

